
Monitoring is where RQ shines.
The easiest way is probably to use the RQ dashboard, a separately distributed tool, which is a lightweight webbased monitor frontend for RQ, which looks like this:
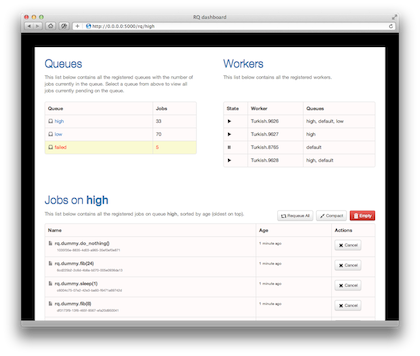
To install, just do:
$ pip install rq-dashboard
$ rq-dashboard
It can also be integrated easily in your Flask app.
To see what queues exist and what workers are active, just type rq info:
$ rq info
high       |██████████████████████████ 20
low        |██████████████ 12
default    |█████████ 8
3 queues, 45 jobs total

Bricktop.19233 idle: low
Bricktop.19232 idle: high, default, low
Bricktop.18349 idle: default
3 workers, 3 queues
You can also query for a subset of queues, if you’re looking for specific ones:
$ rq info high default
high       |██████████████████████████ 20
default    |█████████ 8
2 queues, 28 jobs total

Bricktop.19232 idle: high, default
Bricktop.18349 idle: default
2 workers, 2 queues
By default, rq info prints the workers that are currently active, and the
queues that they are listening on, like this:
$ rq info
...

Mickey.26421 idle: high, default
Bricktop.25458 busy: high, default, low
Turkish.25812 busy: high, default
3 workers, 3 queues
To see the same data, but organised by queue, use the -R (or --by-queue)
flag:
$ rq info -R
...

high:    Bricktop.25458 (busy), Mickey.26421 (idle), Turkish.25812 (busy)
low:     Bricktop.25458 (busy)
default: Bricktop.25458 (busy), Mickey.26421 (idle), Turkish.25812 (busy)
failed:  –
3 workers, 4 queues
By default, rq info will print stats and exit.
You can specify a poll interval, by using the --interval flag.
$ rq info --interval 1
rq info will now update the screen every second. You may specify a float
value to indicate fractions of seconds. Be aware that low interval values will
increase the load on Redis, of course.
$ rq info --interval 0.5